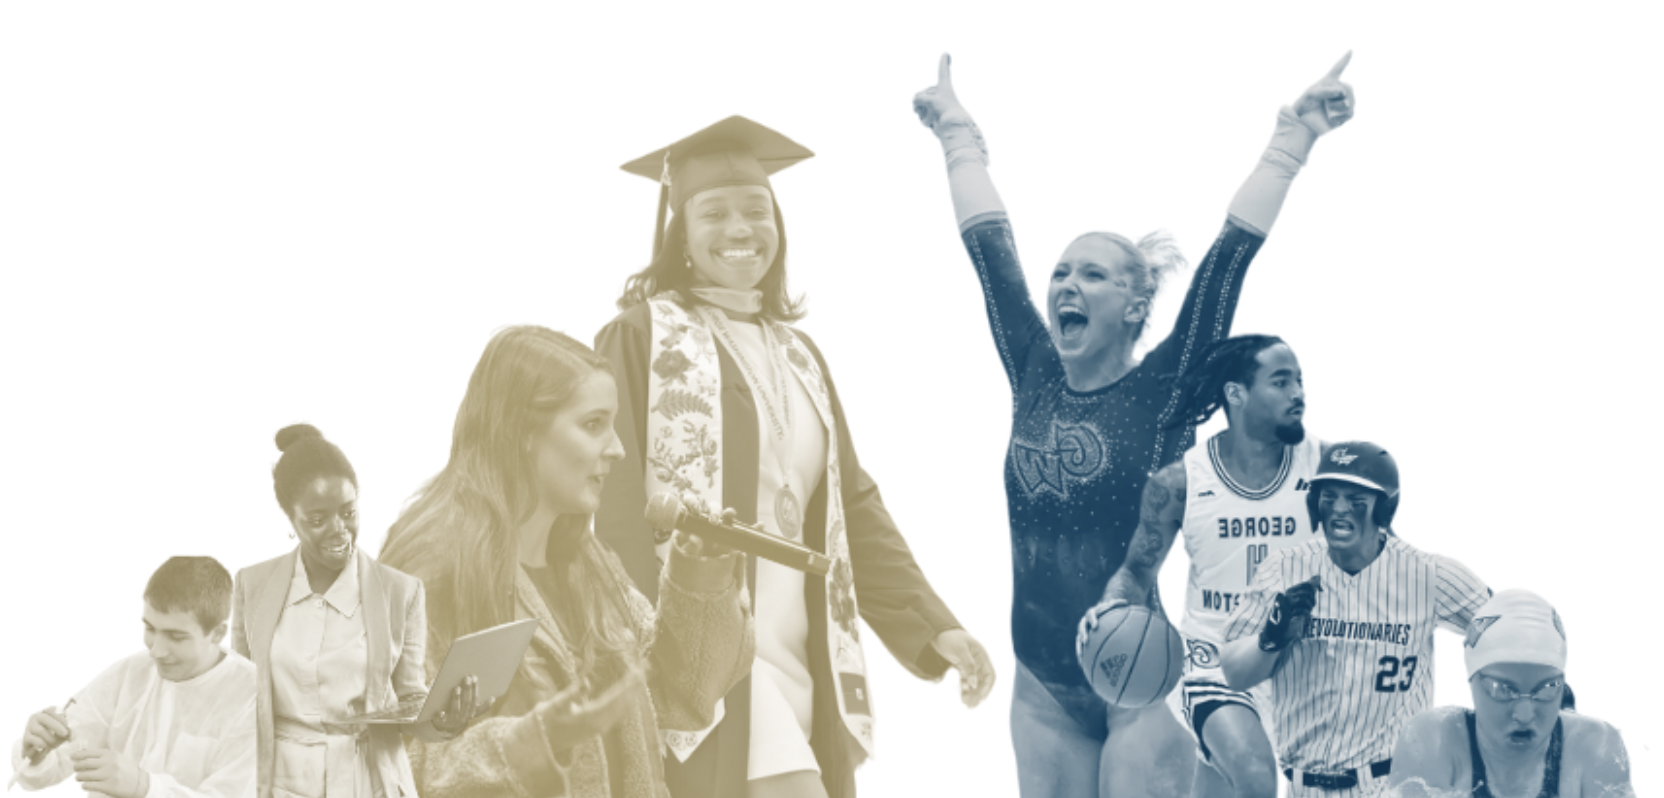
The Eligibility Playbook: How GWU Keeps Its Athletes on the Field, Not in the Classroom
-
Description
As a Journalism minor and final project for Digital Reporting: Data Journalism, I investigated academic leniency for Division I athletes at GWU. Using interviews and original data—covering GPA trends, major clustering, and eligibility accommodations—I revealed how systems often prioritize athletic eligibility over education. I built four custom datasets and used visual storytelling to present evidence-based findings, applying skills in ethical sourcing, analysis, and public accountability.
-
Pitch
Are student-athletes at GW truly held to the same academic standards as their peers—or are they quietly shielded by a system that rewards eligibility over education? I hypothesized that athletes receive strategic academic support—sometimes excessive—to stay competition-ready, with flexible deadlines, adjusted grading, and advising geared toward less rigorous majors. With a reported 3.44 GPA and 94% graduation rate, GW’s athletes appear to excel. But interviews and data suggest these numbers don’t tell the full story. This project investigates how performance optics, institutional priorities, and NCAA policies shape what it means to be a “student-athlete”—and whether universities are redefining education to keep their athletes in play.
-
DATA STRATEGY + METHODS
GPA & Graduation Rates: Compiled athlete vs. non-athlete academic data from GWU institutional sources and NCAA reports, then cross-checked with independent metrics like the Adjusted Graduation Gap to identify discrepancies.
Major Clustering: Manually analyzed over 400 student-athlete profiles to determine declared majors. Identified clustering in departments with lower national academic rigor, suggesting institutional steering.
National Context: Researched 50 academic leniency cases—one from each U.S. state—to demonstrate the systemic nature of academic flexibility for athletes across the country.
Elite Admissions & Athletics: Tracked the percentage of student-athletes in Harvard’s incoming classes (2016–2028) using public rosters and Crimson admissions reports. Revealed a trend of growing athletic enrollment despite lower academic indicators.
-
Analysis
GPA & Graduation Rate Discrepancies: Using institutional data and NCAA reports, I found that while GW athletes maintain a reported 3.44 GPA and a 94% Graduation Success Rate, those numbers omit transfers and dropouts. Alternative metrics—like the Adjusted Graduation Gap—suggest a wider academic performance gap between athletes and non-athletes than the university advertises.
Major Clustering & Strategic Academic Positioning: I reviewed over 400 athlete profiles to identify declared majors and found significant clustering in fields with reputations for lower workloads. When cross-referenced with national rankings, this pointed to institutional steering—highlighting how class schedules and eligibility concerns shape academic trajectories.
National Landscape of Academic Leniency: By compiling one case of academic misconduct or special treatment for athletes from all 50 states, I illustrated how GWU fits into a broader pattern of eligibility-first policies. This reinforces the idea that academic flexibility for athletes isn’t an exception—it’s built into the system.
Admissions Advantage for Athletes at Elite Schools: Analyzing Harvard admissions data and roster composition from 2016–2028, I found that recruited athletes consistently comprise a large share of incoming classes, despite lower academic indicators. This highlights how universities increasingly treat athletics as a branding and fundraising tool—often at odds with stated academic missions.
DATA DISPLAY
With no prior experience in data visualization beyond the occasional Canva graphic, I challenged myself to create interactive graphs for this project. I knew the data could speak louder than words if presented in a way that was clear, engaging, and easy to explore. This meant teaching myself new software, learning the basics of embedded code, and designing the visuals from scratch, even though most of the data had been gathered manually. It was a demanding process, but ultimately worth it to tell the full story in a more compelling, accessible way.
Skills gained…
Skills gained through this project include investigative reporting through in-depth interviews and expert sourcing to humanize the data; data analysis and visualization using spreadsheet functions, manual tracking, and cross-referenced rankings to build four original datasets; strategic communication by crafting a narrative designed to inform, challenge assumptions, and engage readers; and digital storytelling through the creation of a web-based package that combined visuals, clear structure, and accessible, evidence-based insights.